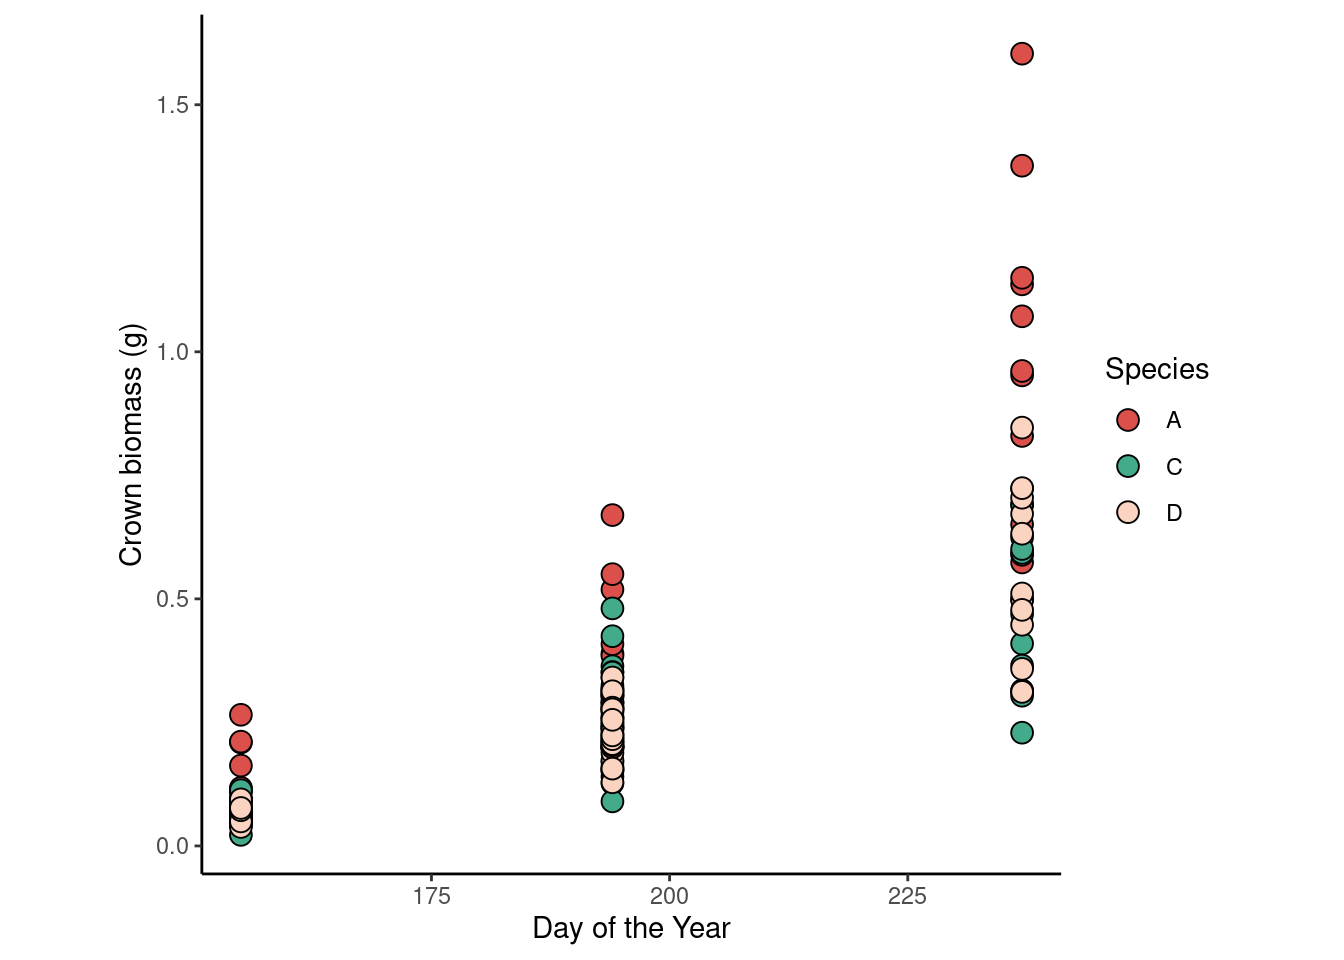
library(tidyverse)url <-"https://raw.githubusercontent.com/jlacasa/stat705_fall2024/main/classes/data/lotus_part3.csv"dd <-read.csv(url)dd %>%ggplot(aes(doy, crown_g))+geom_point(aes(fill = species), shape =21, size =3.5)+scale_fill_manual(values =c("#DB504A", "#43AA8B", "#FAD4C0"))+labs(x ="Day of the Year", y ="Crown biomass (g)", fill ="Species")+theme_classic()+theme(aspect.ratio =1)
Let’s fit the model \[y_{ij} \sim N(\mu_{ij}, \sigma^2),\]
\[\mu_{ij} = \beta_{0j} + \beta_{1j}x_{ij},\] where \(y_{ij}\) is the observation of crown biomass for the \(i\)th observation of the \(j\)th species, \(\mu{ij}\) is its mean and \(\sigma^2\) its variance. The means is described with \(\beta_{0j}\), the intercept of the \(j\)th species and \(\beta_{1j}\), the slope of the \(j\)th species
m <-lm(crown_g ~ species * doy, data = dd)summary(m)
Call:
lm(formula = crown_g ~ species * doy, data = dd)

Residuals:
     Min       1Q   Median       3Q      Max
-0.29416 -0.09688 -0.00858  0.06046  0.73550

Coefficients:
               Estimate Std. Error t value Pr(>|t|)
(Intercept)  -1.5809069  0.1438577 -10.989  < 2e-16 ***
speciesC      0.8764868  0.2034455   4.308 3.11e-05 ***
speciesD      0.6864100  0.2034455   3.374 0.000962 ***
doy           0.0103322  0.0007297  14.159  < 2e-16 ***
speciesC:doy -0.0054042  0.0010320  -5.237 5.96e-07 ***
speciesD:doy -0.0043320  0.0010320  -4.198 4.80e-05 ***
---
Signif. codes:  0 '***' 0.001 '**' 0.01 '*' 0.05 '.' 0.1 ' ' 1

Residual standard error: 0.1467 on 138 degrees of freedom
Multiple R-squared:  0.7207,    Adjusted R-squared:  0.7105
F-statistic: 71.21 on 5 and 138 DF,  p-value: < 2.2e-16
It’s getting much harder to compute the E(y)s by hand!
In the summary, we’re testing if whatever coefficient \(\beta = 0\). That means, the null Hypothesis \(H_0 : \beta_0=0\), and the alternative Hypothesis \(H_1 : \beta_0\ne0\).
summary(m)
Call:
lm(formula = crown_g ~ species * doy, data = dd)

Residuals:
     Min       1Q   Median       3Q      Max
-0.29416 -0.09688 -0.00858  0.06046  0.73550

Coefficients:
               Estimate Std. Error t value Pr(>|t|)
(Intercept)  -1.5809069  0.1438577 -10.989  < 2e-16 ***
speciesC      0.8764868  0.2034455   4.308 3.11e-05 ***
speciesD      0.6864100  0.2034455   3.374 0.000962 ***
doy           0.0103322  0.0007297  14.159  < 2e-16 ***
speciesC:doy -0.0054042  0.0010320  -5.237 5.96e-07 ***
speciesD:doy -0.0043320  0.0010320  -4.198 4.80e-05 ***
---
Signif. codes:  0 '***' 0.001 '**' 0.01 '*' 0.05 '.' 0.1 ' ' 1

Residual standard error: 0.1467 on 138 degrees of freedom
Multiple R-squared:  0.7207,    Adjusted R-squared:  0.7105
F-statistic: 71.21 on 5 and 138 DF,  p-value: < 2.2e-16