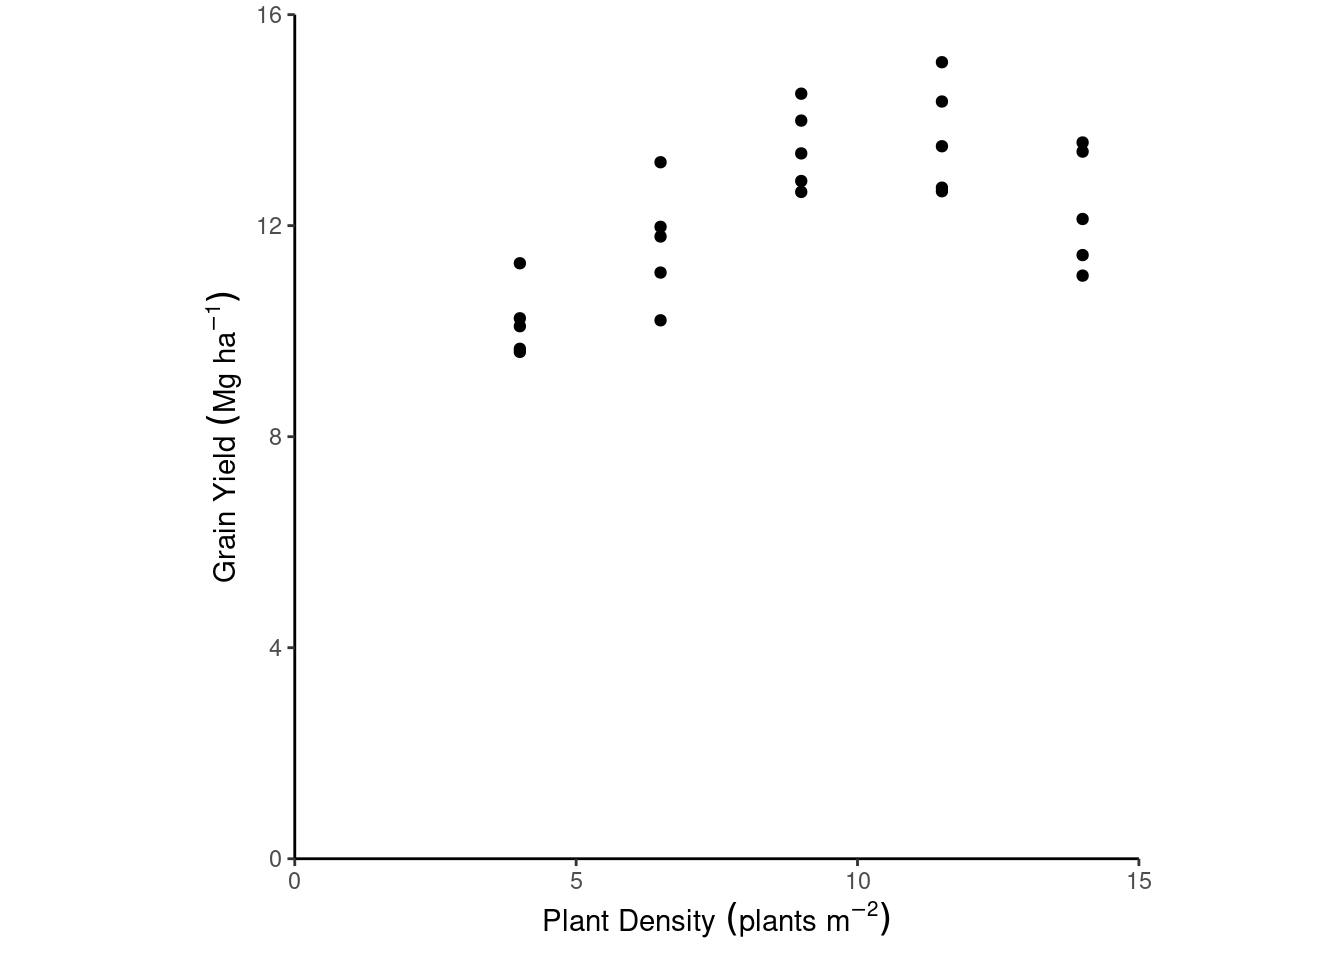
What would be a good statistical model for these data?
The yield from the \(i\)th observation, \(y_i\), can be described as \[y_i \sim N(\mu_i , \sigma^2),\]
\[\mu_i = \beta_0 + \beta_1 x_i + \beta_2 x_i^2 ,\] for \(i =1, 2, ..., n\), where \(n\) is the total number of observations, \(\mu_i\) is the mean of the \(i\)th observation, \(\beta_0\) is the intercept (i.e., the yield with zero plants), \(\beta_1\) and \(\beta_2\) determine the shape of the quadratic curve, \(x_i\) is the plant density of the \(i\)th observation, and \(\sigma^2\) is the variance of the data.
m <-lm(yield_Mgha ~ plant_density +I(plant_density^2), data = data)summary(m)
Call:
lm(formula = yield_Mgha ~ plant_density + I(plant_density^2),
    data = data)

Residuals:
    Min      1Q  Median      3Q     Max
-1.9426 -0.6571 -0.1711  0.9246  1.6917

Coefficients:
                   Estimate Std. Error t value Pr(>|t|)
(Intercept)         4.30879    1.38213   3.117 0.005016 **
plant_density       1.74562    0.33964   5.140 3.76e-05 ***
I(plant_density^2) -0.08300    0.01862  -4.458 0.000197 ***
---
Signif. codes:  0 '***' 0.001 '**' 0.01 '*' 0.05 '.' 0.1 ' ' 1

Residual standard error: 0.9736 on 22 degrees of freedom
Multiple R-squared:  0.6493,    Adjusted R-squared:  0.6174
F-statistic: 20.37 on 2 and 22 DF,  p-value: 9.866e-06
opd_se_hat <- msm::deltamethod(g =~-x2/(2*x3), mean =coef(m), cov = covariance)opd_hat -1.96*opd_se_hat ## 1.96 is typically used for approximate confidence intervals
plant_density
     9.584308
opd_hat +1.96*opd_se_hat
plant_density
     11.44619
Summary
Why are uncertainty estimates important?
What are uncertainty estimates telling us?
Which variables have uncertainty? Which ones don’t?