Day 19 - 10/02/2024
From last class
- link to presentation pdf
- Kahoot
Model selection
- Why do we fit statistical models?
- How do we know our model is the best?
- What defines the “goodness” of a model?

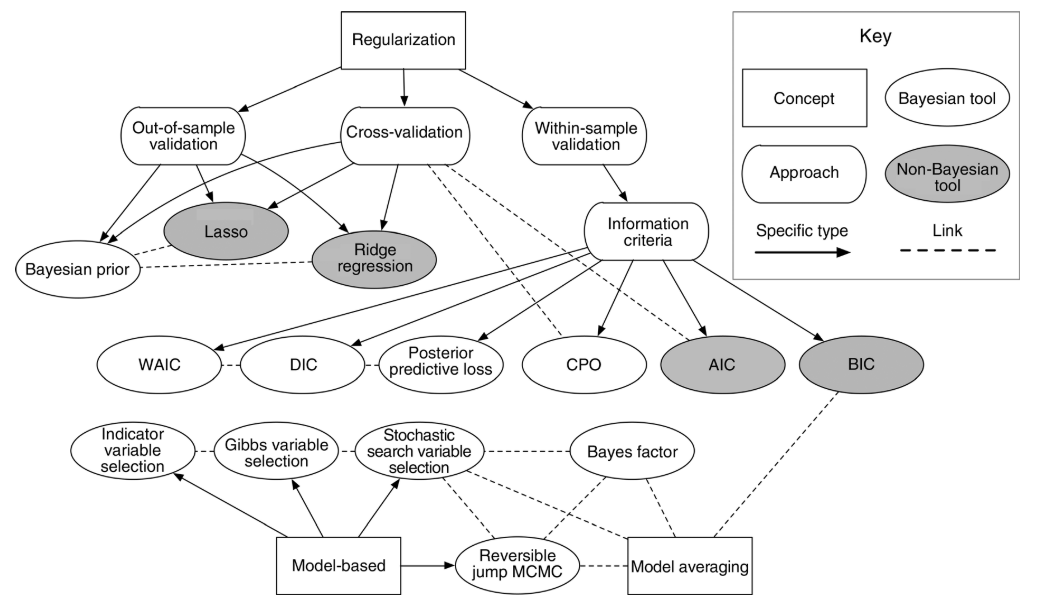
Figure 2 in Hooten et al. (2015).
A few important metrics
The F test
- Tests the “global null hypothesis” (i.e., none of the predictor variables are related to the response).
F is calculated as
\[F=\frac{(TSS-RSS)/p}{RSS/(n-p-1)},\]
where \(TSS\) and \(RSS\) are the total and residual sums of squares, respectively, \(p\) is the number of parameters, and \(n\) is the total number of observations.
The coefficient of determination R2
- Usually interpreted as the proportion of the variation in y that is explained with the variation in x.
- Used as a metric for predictive ability and model fit.
- Can increase when adding more predictors.
The R2 of a given model (and observed data) is calculated as \[R^2 = \frac{MSS}{TSS}= 1 - \frac{RSS}{TSS},\] where \(RSS\) is the residual sum of squares and \(TSS\) is the total sum o squares.
- Write out formula on whiteboard.
Adjusted R2
The adjusted R2 also penalizes the addition of extra parameters
\[R^2_{adj} = R^2 - (1 - R^2) \frac{p-1}{n-p},\] where \(R^2\) is the one defined above, \(p\) is the number of parameters and \(n\) is the total number of observations.
Akaike Information Criterion (AIC)
- Used as a metric for predictive ability and model fit.
- Lower value is better.
- Values are always compared to other models (i.e., there are no general rules about reasonable AIC values).
The AIC of a given model \(M\) and observed data \(\mathbf{y}\) is calculated as
\[AIC_M = 2p - 2\log(\hat{L}),\]
\(p\) is the number of parameters estimated in the model and \(\hat{L}\) is the maximized value of the likelihood function for the model (i.e., \(\hat{L}=p(\mathbf{y}|\hat{\boldsymbol\beta}, M)\)).
Bayesian Information Criterion (BIC)
The BIC of a given model (and observed data) is a variant of AIC and is calculated as
\[BIC = p\log(n) - 2\log(\hat{L}),\]
where \(p\) is the number of parameters estimated in the model, \(n\) is the number of observations, and \(\hat{L}\) is the maximized value of the likelihood function for the model (i.e., \(\hat{L}=p(\mathbf{y}|\hat{\boldsymbol\beta}, M)\)).
A few thoughts
- We are using the data twice!
- Other techniques, also depending on modeling objective.
For next class
- Read Chapter 8 (Variable selection)
- Assignment 3.
- Mid-semester feedback survey.